Image Processing Basics
Digital image processing pipeline overview.
Digital Image Processing means processing digital images using a digital computer. It involves the use of computer algorithms to enhance images or extract useful information. It uses algorithms and mathematical models to process and analyze digital images. The goal is to enhance image quality, extract meaningful information, and automate image-based tasks.
Basic Steps in Digital Image Processing
Section titled “Basic Steps in Digital Image Processing”- Image acquisition: Capturing an image using a digital camera or scanner, or importing an existing image into a computer.
- Image enhancement: Improving visual quality by increasing contrast, reducing noise, and removing artifacts.
- Image restoration: Removing degradation such as blurring, noise, and distortion.
- Image segmentation: Dividing an image into regions or segments that correspond to specific objects or features.
- Image representation and description: Representing an image in a way that can be analyzed and manipulated, and describing its features in a compact manner.
- Image analysis: Using algorithms to extract information, recognize objects, detect patterns, and quantify features.
- Image synthesis and compression: Generating new images or compressing existing ones to reduce storage and transmission needs.
Digital image processing is widely used in applications such as medical imaging, remote sensing, computer vision, and multimedia.
Image Processing Steps
Section titled “Image Processing Steps”- Importing the image: Using image acquisition tools to bring the image into the system.
- Analyzing and manipulating the image: Applying various techniques to modify or extract information from the image.
- Output: The result can be either an altered image or a report based on the analysis.
What is an Image?
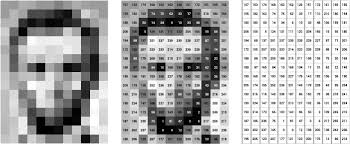
Section titled “What is an Image?”An image is defined as a two-dimensional function, , where and are spatial coordinates. The amplitude of at any pair of coordinates is called the intensity of the image at that point. When , , and amplitude values are finite, it is referred to as a digital image. In other words, an image can be defined by a two-dimensional array arranged in rows and columns. A digital image consists of finite elements, each with a value at a specific location. These elements are called picture elements, image elements, or pixels. Pixel is the most commonly used term.
Types of Images
Section titled “Types of Images”- Binary image: Contains only two pixel values, 0 and 1, where 0 represents black and 1 represents white. Also known as Monochrome.
- 8-bit color format: Commonly known as Grayscale Image, it has 256 shades of gray. In this format, 0 stands for black, 255 stands for white, and 127 stands for gray.
- 16-bit color format: Known as High Color Format, it includes 65,536 colors. It is divided into three further formats: Red, Green, and Blue, forming the RGB format.
Image as a Matrix
Section titled “Image as a Matrix”Images are represented in rows and columns as follows:
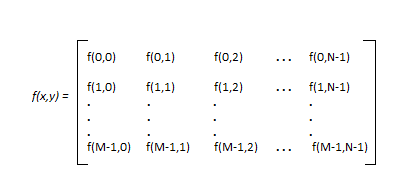
An image represented as a matrix of pixel values.
Every element of this matrix is called an image element, picture element, or pixel.
Phases of Image Processing
Section titled “Phases of Image Processing”- Acquisition: This includes tasks such as scaling and color conversion (e.g., RGB to Gray).
- Image enhancement: Used to extract hidden details and improve image appeal, but it is subjective.
- Image restoration: Deals with improving image appeal based on mathematical or probabilistic models of degradation.
- Color image processing: Handles pseudocolor and full color image processing using color models.
- Wavelets and multi-resolution processing: Represents images at various degrees of resolution.
- Image compression: Focuses on reducing image size or resolution.
- Morphological processing: Extracts components useful in shape representation and description.
- Segmentation procedure: Involves partitioning an image into parts or objects; autonomous segmentation is particularly challenging.
- Representation and description: Involves choosing a representation and transforming raw data into processed data.
- Object detection and recognition: Assigns labels to objects based on their descriptors.
What is Pixel?
Section titled “What is Pixel?”A pixel, short for “picture element,” is the smallest unit of a digital image or display that can be controlled or manipulated. Pixels are the smallest fragments of a digital photo. Pixels are tiny square or rectangular elements that make up the images we see on screens, from smartphones to televisions.
Every pixel in the image is marked by its coordinates and contains information about color and brightness or sometimes opacity level has a place for each and all pixels.
Understanding pixels is crucial in digital imaging and photography, as they determine the resolution and quality of an image. An image consists of several pixels that define its resolution. For example, a resolution of 1920×1080 would typically be related to a Full HD screen. In this instance, the total number of pixels is 1080 x 1920 (altogether more than two million dots that form an image on the screen).
Defining Key Terminologies
Section titled “Defining Key Terminologies”-
Pixel (Picture Element): A pixel is the smallest part of a computer picture. It represents one spot in the entire photo. Each small square has information about color, brightness, and position. When these squares are combined with others, they create a complete picture that we can see. Pixels are the components that make up digital screens, arranging together to display letters, pictures, and videos.
-
Resolution: Resolution refers to the number of tiny squares, called pixels, in a digital photo. It is usually measured by width and height. Higher resolution provides more detail in images. Common measurements for resolution are pixels per inch (PPI) for printed images and pixels per centimeter (PPCM). For example, a screen with a resolution of 1920 x 1080 has 1920 pixels horizontally and 1080 pixels vertically.
-
Pixel Density: Display resolution, often shown as pixels per inch (PPI) for screens, determines how clear a picture looks. More pixels lead to sharper images. Mobile phones with high pixel density often have clearer and more colorful displays.
-
Color Depth: Bit depth, also known as color depth, indicates how many bits are used to represent the color of each pixel. Common values are 8-bit, 16-bit, and 24-bit color levels. More bits allow a pixel to display a wider range of colors, resulting in richer and more detailed images.
-
Raster and Vector Graphics: In raster graphics, pixels play a crucial role. These images are composed of many tiny squares called pixels. In contrast, vector graphics use mathematical equations to create shapes, allowing them to scale without losing quality. Vector graphics are ideal for applications like logos and illustrations.
-
Aspect Ratio: The aspect ratio refers to the ratio of an image’s width to its height. Common aspect ratios include 4:3, 16:9, and 1:1. Different devices and media may have specific size requirements, affecting how images are displayed or captured.
Color Spaces
Section titled “Color Spaces”RGB Color Space
Section titled “RGB Color Space”RGB images can be viewed as three different images (a red scale image, a green scale image, and a blue scale image) stacked on top of each other. When fed into the red, green, and blue inputs of a color monitor, it produces a color image on the screen.
- The RGB color model blends Red, Blue, and Green colors together to form an array of colors.
- In this article, we will learn the concept of extracting RGB components from an image and calculating RGB values of pixels using the MATLAB interface.
- An RGB image is sometimes referred to as a true color image, as the precision with which a real-life image can be replicated has led to the nickname “true color image.”
Advantages of the RGB Color Model
Section titled “Advantages of the RGB Color Model”- No transformations are required to display data on the screen.
- It is considered the base color space for various applications.
- It is a computationally practical system.
- Using its additive property, it is employed in video displays.
- This model is very easy to implement.
- Some of its uses are as follows:
- In displays
- In cameras
- In scanners
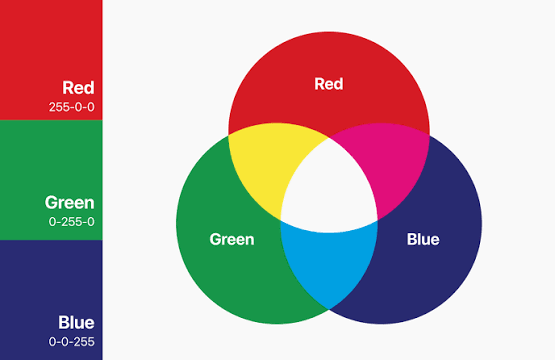
The RGB color model.
An RGB image is essentially a array of color pixels, where each color pixel is associated with three values corresponding to the red, blue, and green color components of the RGB image at a specified spatial location.
- The color of any pixel is determined by the combination of the red, green, and blue intensities stored in each color plane at the pixel’s location. Each color plane is an array.
- Let an RGB image be of class ‘uint8’, meaning the range of values a color component plane can have is , which results in [0 – 255] (a total of 256 shades of that color). Each individual color plane of an RGB image can show 256 shades of that color. Thus, the total number of color combinations that can be represented in an RGB image is , approximately 16 million.

Pixels of an RGB image formed from the corresponding pixels of the three color components.
As seen in the image above, Pixel(A) has the value (255, 0, 255) and is determined by the combination of intensities stored in the red, green, and blue color planes, respectively. Similarly, Pixel(B) has the value (127, 255, 0) and is determined in the same manner as Pixel(A).
Color Planes of an RGB Image
Section titled “Color Planes of an RGB Image”Consider an RGB image array ‘I’. To use the image in MATLAB, you must add the address of the image in the MATLAB drive and copy the address into the respective code.
I(:, :, 1)represents the Red color plane of the RGB image.I(:, :, 2)represents the Green color plane of the RGB image.I(:, :, 3)represents the Blue color plane of the RGB image.
HSV Color Space
Section titled “HSV Color Space”An HSV color model is the most accurate representation of how humans perceive colors. Humans perceive colors differently compared to how RGB or CMYK create colors. The H stands for Hue, S stands for Saturation, and V stands for Value. Imagine a cone with a spectrum of red to blue from left to right, and from the center to the edge, the color intensity increases. From bottom to top, the brightness increases, resulting in white at the center up layer. A pictographic representation is shown below.
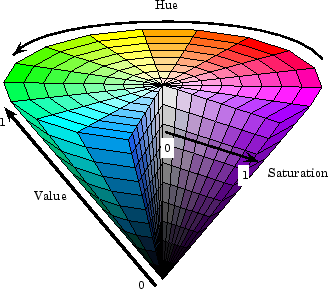
The HSV color model represented as a cone.
- Hue: Hue tells the angle to look at the cylindrical disk. The hue represents the color. The hue value ranges from 0 to 360 degrees.
| Angle (in degrees) | Color |
|---|---|
| 0-60 | Red |
| 60-120 | Yellow |
| 120-180 | Green |
| 180-240 | Cyan |
| 240-300 | Blue |
| 300-360 | Magenta |
- Saturation: The saturation value tells us how much of the respective color must be added. A 100% saturation means that pure color is added, while a 0% saturation means no color is added, resulting in grayscale.
- Value: The value represents the brightness concerning the saturation of the color. A value of 0 represents total black darkness, while a value of 100 indicates full brightness, depending on the saturation.
Advantages:
Section titled “Advantages:”The advantage of HSV is that it generalizes how humans perceive color, making it the most accurate depiction of how we perceive colors on the computer screen. Additionally, the HSV color space separates luma from color information. This allows for operations like histogram equalization to be performed only on intensity values.
-
Some of its uses are as follows:
- HSV model is used in histogram equalization.
- Converting grayscale images to RGB color images.
- Visualization of images is easier as by plotting the H and S components, we can vary the V component or vice versa to see different visualizations.